If you’re running a small business or just dipping your toes into financial analysis, you’ve probably heard the term “contribution margin” thrown around. It’s one of those concepts that sounds a bit fancy but is actually pretty straightforward once you break it down.
Think of it as a key metric that tells you how much money each sale contributes to covering your fixed costs and, eventually, turning a profit. I’ll walk you through how to calculate contribution margin step by step, why it matters, and some real-world examples to make it stick.
What Is Contribution Margin Anyway?
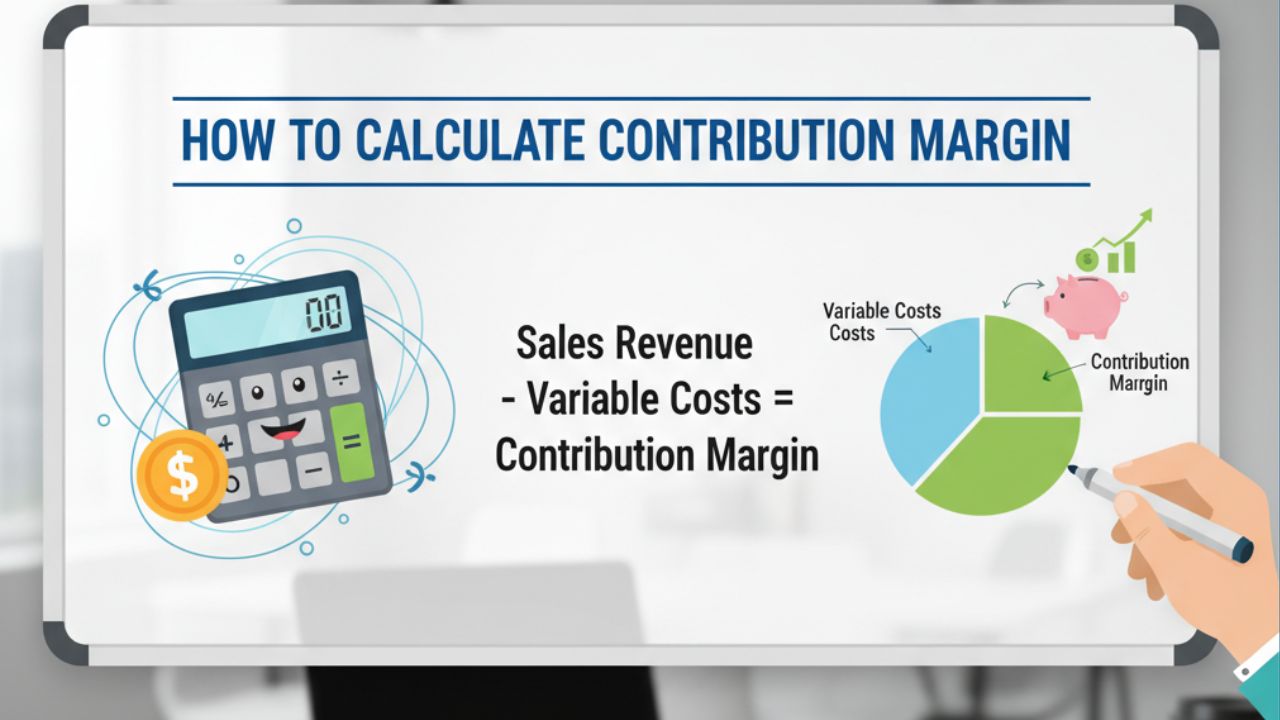
At its core, contribution margin is the difference between your sales revenue and the variable costs tied directly to producing or selling your product or service.
Variable costs are things that change based on how much you produce like materials, labor, or shipping fees. Fixed costs, on the other hand, stay the same no matter what, such as rent or salaries.
Why does this matter? Well, after subtracting those variable costs, what’s left “contributes” to paying off your fixed expenses. Once those are covered, the rest is pure profit.
It’s a simple way to see if your business model is sustainable. For instance, if your contribution margin is too low, you might need to raise prices or cut costs to avoid losing money in the long run.
Business experts often use this metric to evaluate product lines or decide on promotions. It’s not just for big corporations; even freelancers can apply it to hourly services by treating time as a variable cost.
Why Should You Bother Calculating Contribution Margin?
Calculating contribution margin isn’t just busywork, it’s a game-changer for decision-making. First off, it helps with break-even analysis. That’s the point where your total revenue equals total costs, and you’re not making or losing money. Knowing your contribution margin lets you figure out how many units you need to sell to hit that sweet spot.
It also shines a light on profitability. Say you have multiple products; comparing their contribution margins can show which ones are worth pushing harder. Maybe your high-end item has a bigger margin than the budget version, so you focus marketing there.
Plus, in tough times like inflation or supply chain hiccups, this calculation helps you adjust prices without guessing. It guides questions like: “Can I afford a discount?” or “Should I drop this underperforming service?” Overall, it’s about working smarter, not harder, to boost your bottom line.
The Basic Formula for Contribution Margin
Ready for the math? Don’t worry—it’s not rocket science. The contribution margin formula comes in two main flavors: per unit and total.
For a single unit (like one product sold):
Contribution Margin per Unit = Selling Price per Unit – Variable Cost per Unit
For your overall business or a batch:
Total Contribution Margin = Total Sales Revenue – Total Variable Costs
That’s it! No fancy algebra required. Just make sure you’re consistent with your numbers—use dollars for everything, and double-check your costs.
Sometimes people express it as a ratio or percentage to compare across different scales. The contribution margin ratio is:
Contribution Margin Ratio = (Contribution Margin / Sales Revenue) × 100%
This percentage shows what portion of each sales dollar goes toward fixed costs and profits. A higher ratio means more efficiency.
Step-by-Step Guide: How to Calculate Contribution Margin
Let’s make this hands-on. I’ll guide you through calculating it with a simple example. Imagine you own a coffee shop selling lattes.
Step 1: Identify Your Selling Price
How much do you charge per latte? Let’s say $5.
Step 2: List Variable Costs
These are costs per latte: coffee beans ($1), milk ($0.50), cup and lid ($0.30), and barista time ($0.70). Total variable costs: $2.50.
Step 3: Crunch the Numbers
Contribution Margin per Unit = $5 – $2.50 = $2.50. So, each latte contributes $2.50 toward rent, utilities, and profit.
Step 4: Scale It Up
If you sell 200 lattes a month, Total Contribution Margin = 200 × $2.50 = $500.
Step 5: Check the Ratio
Ratio = ($2.50 / $5) × 100% = 50%. Half of every sale covers fixed costs and adds to profits.
See? Quick and painless. Grab a spreadsheet or calculator, and plug in your own numbers. If your variable costs fluctuate, update them regularly for accuracy.
Real-World Examples of Contribution Margin in Action
Examples make everything clearer, right? Let’s look at a couple from different industries.
First, a manufacturing business. Suppose a company makes widgets. Each sells for $100, with variable costs of $60 (materials $40, labor $20). Contribution Margin per Unit = $100 – $60 = $40.
If fixed costs are $20,000 monthly, break-even units = $20,000 / $40 = 500 widgets. Sell more than that, and you’re in profit territory.
Now, a service-based example: A graphic designer charges $200 per logo. Variable costs? Software subscription prorated per project ($20) and time (but if it’s your time, treat it as variable if billable). Say $30 total. Contribution Margin = $200 – $30 = $170.
For a SaaS company, subscription revenue might be $50/month per user, with variable costs like server usage ($10). Margin: $40. This helps decide on customer acquisition costs—if it costs $100 to get a user, you need them for at least three months to break even on that front.
These scenarios show how versatile the calculation is. Adapt it to your setup, whether products or services.
Contribution Margin Ratio and Percentage: Digging Deeper
We touched on the ratio earlier, but let’s expand. The contribution margin percentage tells you efficiency at a glance. A 40% ratio means 40 cents of every dollar sold contributes to fixed costs and profits.
Why use percentage over dollars? It’s great for comparisons. If Product A has a 30% margin and Product B 50%, push B more, even if A’s absolute margin is higher due to volume.
To calculate: Divide contribution margin by revenue, multiply by 100. Simple.
In multi-product businesses, weighted average contribution margin helps. Sum (Each Product’s Margin × Sales Mix Percentage). This gives a blended view for overall planning.
How Contribution Margin Fits into Break-Even Analysis
Break-even is a big reason to calculate contribution margin. The formula: Break-Even Point (in units) = Fixed Costs / Contribution Margin per Unit.
For dollars: Break-Even Sales = Fixed Costs / Contribution Margin Ratio.
Say fixed costs are $10,000, margin per unit $20. You need 500 units to break even.
This insight is gold for setting sales targets or evaluating new ventures. If margins are slim, you might need massive volume—think discount stores. High margins? Fewer sales suffice, like luxury goods.
Applications in Pricing and Cost Management
Contribution margin isn’t just a number—it’s a tool for strategy. In pricing, if costs rise, you can see how much to increase prices without losing contribution.
For cost control, focus on slashing variable costs. Negotiate better supplier deals or streamline production to boost margins.
In product mix decisions, drop low-margin items if they drag down the average. Or use it for special orders: If a bulk deal has a positive margin, it might be worth it even at a discount.
Managers also use it for performance bonuses or budgeting. It’s everywhere in smart business ops.
Common Mistakes to Avoid When Calculating
Even pros slip up. One biggie: Mixing fixed and variable costs. Rent isn’t variable—don’t include it!
Another: Forgetting indirect variables like commissions. Track everything.
Not updating for changes? Costs fluctuate; recalculate often.
Ignoring the ratio for just dollars can mislead in growing businesses. Always look at both.
Finally, don’t rely solely on this—pair it with net profit for the full picture.
Tools and Software to Simplify Calculations
Pen and paper work, but tech makes it easier. Excel or Google Sheets: Use formulas like =B2-C2 for margin.
Accounting software like QuickBooks or Xero auto-calculates based on your data.
For advanced, ERP systems or tools like Cube integrate it into dashboards.
Free online calculators exist too—just search “contribution margin calculator” for quick checks.
FAQs About How to Calculate Contribution Margin
Q. What’s the difference between contribution margin and gross margin?
Contribution margin subtracts only variable costs from revenue, while gross margin subtracts cost of goods sold (which might include some fixed costs). Contribution is more focused on variable impacts.
Q. Can contribution margin be negative?
Yes, if variable costs exceed selling price. That’s a red flag—means you’re losing money per unit before fixed costs. Time to rethink pricing or costs.
Q. How often should I calculate contribution margin?
At least quarterly, or whenever costs or prices change. Monthly for volatile industries like retail.
Conclusion
There you go, a complete rundown on how to calculate contribution margin and why it’s your business’s best friend. It’s not about complex finance; it’s about clear insights to grow smarter. Start with your own numbers today, and watch how it sharpens your decisions. Whether tweaking prices or planning expansions, this metric keeps things real.
Disclaimer: This article is for informational purposes only and not financial advice. Consult a professional accountant for personalized guidance. Business decisions involve risks, and results may vary.